Inflation is down by 700 bp since 2013, and policy rates have declined by 200bp — and you are still wondering why GDP growth is slow?
The GDP growth number for the latest quarter (2017Q2) was bad, very bad. It came in at a year-on-year growth of 5.7 per cent. Just to provide a perspective — the low growth reported was the eighth worse quarter since 2011, and the 14th worst quarter since the start of the high growth period in 2003/04. You want more evidence on the lowness of this growth number? The average GDP growth for the two years prior to the election of Narendra Modi election in May 2014 was 6.4 per cent; even if for the rest of this fiscal year GDP growth averages an unlikely 6.5 per cent each quarter, the fiscal year numbers will not match the UPA average for their bad years. Yes, that is how bad GDP growth is today.
It is imperative that the political and economic policymakers in the Modi government get down to identifying the cause of this downturn. National elections are just 18 months away, and does the BJP actually believe that a growth rate below the UPA’s worst years will not dent its popularity?
Prior to the 2017Q2 number, the favourite refrain of the Modi detractors or Congress supporters (same set of individuals) was that the high GDP growth rate in 2014/15 and 2015/16 (7.5 and 8 per cent, respectively) was caused by political manipulation of the figures by the Central Statistical Organisation (CSO). The critics were too politically correct to say so openly but they clearly implied that the CSO was fudging the growth figures at the behest of the BJP government. Now that the GDP numbers conform to their political priors, there is not a squeak from all these statistical doubters; these critics-without-base should either come out with their latest updates on GDP growth in India or at least apologise to the CSO for doubting their integrity and expertise.
The media and economic experts have noted the phenomenon of low growth and have offered two explanations. The most common, near universal explanation, is the equivalent of the butler did it. In other words, the closest, most proximate (and coincidentally most popular with the anti-Modi crowd) cause of the growth slowdown is demonetisation.
Besides convenience, this explanation has some theory to back it up: If for a cash-dependent economy, you remove its lifeline (over 86 per cent of cash was demonetised on November 8, 2016) then obviously you will get a crash in output. As the “experts” point out with glee, a 2 per cent decline in GDP growth was exactly what was predicted by them to be the consequence of demonetisation. Growth has shown a big decline, and the world economy is booming, so India is in low growth mode because of demonetisation.
The second most popular explanation centres around the appreciation of the RBI’s nominal 36-country real effective exchange rate (REER). Some noted economists are behind this logic, hence, this hypothesis deserves serious examination. For the moment, let it be noted that for the first eight months of this year, exports (in US dollar terms) are up 12.1 per cent, while the REER has appreciated by 4.8 per cent. For the last six years, and excluding the bad trade year of 2015 (export and import growth were — 15 per cent and — 12 per cent, respectively), both export growth and REER appreciation in 2017 are the highest observed. Between 2012 and 2016, export growth had averaged 0.3 per cent, and REER an average depreciation of 1.6 per cent.
For the moment, the export explanation for the growth slowdown is perhaps even less meaningful than demonetisation.
So what does explain the downturn? Bad weather or bad karma? Maybe the latter. One fact noted by some objective experts is that the growth slowdown preceded de-monetisation. After hitting a peak of 9.1 per cent in 2016Q1, quarterly GDP growth registered 7.9 and 7.5 per cent in the subsequent quarters, that is, at the time of demonetisation, GDP growth was already down to 7.5 per cent, a full 1.6 per cent below the peak reached just two quarters earlier.
If one has to explain the growth slowdown without recourse to conspiracy theories about data manipulation (we can’t really do that now because growth is lower, much lower, than what the so-called data manipulators would like) one has to begin to answer the following two questions: What determines growth, and which of these determinants was flashing a red signal before demonetisation.
In most countries (strike that and replace with all countries except a unique country called India) the above question has the same answer — look at interest rates, stupid. No matter what country you go to, central bank and government officials have the same answer and the same policy: If you want to increase demand (up the GDP growth rate), decrease interest rates; if you want to decrease demand, increase interest rates. Why Indian macro-experts almost never offer this policy is a question I can’t answer — a psychiatrist might do much better.
That interest rates do matter in India, and matter a lot, can be shown as follows. We look at only those sectors most susceptible or sensitive to interest rate policy. Agriculture can be ruled out, as it is most influenced by the weather; public utilities, public administration and defence should be excluded from the analysis, as these sectors are more susceptible to the whims and decisions of bureaucrats rather than the babus residing in Mumbai.
Which leaves us with manufacturing, mining, services (excluding public administration) and construction. Both mining and manufacturing (M&M) are problematic for any analysis because these two sectors have been plagued with high corruption, and even higher bad balance sheets (NPAs or non-performing assets). It is likely that resolution of the NPA problem will significantly improve investments and growth, but the resolution will need a different instrument than lowering interest rates.
If one takes only the interest rate sensitive sectors (services – public administration + construction) then one can estimate interest sensitivity of output growth. This sector can also be thought of as the demonetisation sector. Agriculture and government expenditures bias GDP growth upwards, balance sheet considerations bias GDP growth downwards. These sectors are ignored in our calculations.
The chart shows the relationship between the growth in the interest-sensitive (demonetisation) sector and lagged real SBI lending rates. Data are presented for fiscal years from 1978 to 2015. Note the strong central negative relationship for close to 40 years. Each 100 bp increase in the one-year lagged real lending rate decreases growth by 40 bp. Between 2012 and 2014, the one year lagged real lending rate averaged around 5 per cent; the corresponding values for 2015 and 2016, 8.8 and 9.7 per cent. So annual growth in the fiscal year 2017/18 is expected to be around 2 percentage points lower than that observed in 2015.
Average growth in the demonetisation sector in 2015-16 was 9 per cent — hence, 7 per cent is the expected growth for this sector in 2017/18. We have only two observations since demonetisation — 2017Q1 and 2017Q2; sector growth rate in these two quarters was 6.5 and 7.9 per cent respectively, or an average of 7.2 per cent.
We don’t want to push the analysis too far in the direction that only interest rates matter — there is the weather, animal spirits, momentum, confidence, and a host of other vaguely important factors. However, no matter what explanation you come up with, you will have to circle back to interest rates — the evidence is that strong. But go ahead, disregard the evidence. You are in good company with the experts at the RBI (and MPC). They must know better, otherwise why else will they keep real interest rates at world-beating levels?
It is Interest Rates (Stupid) – “Demonetization’ Sector Growth and Lending Rates, 1978-2015
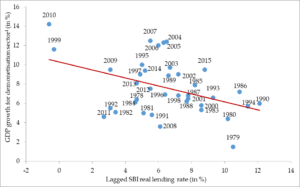
Note: 1. The demonetization sector is defined as GDP minus mining minus manufacturing minus utilities minus public administration and defense
2. SBI real lending rate is calculated as the difference between nominal lending rate and y-o-y CPI inflation; it is lagged one year for analysis